Retail KPI Benchmark Cheat Sheet
Know Instantly If Your Numbers Are Healthy—or Quietly Killing Your Profit
Overview
Most retailers track KPIs… but have no idea if their numbers are actually good.
This cheat sheet gives you clear benchmark ranges, red flags, and action triggers so you can instantly diagnose performance and know exactly what to fix.
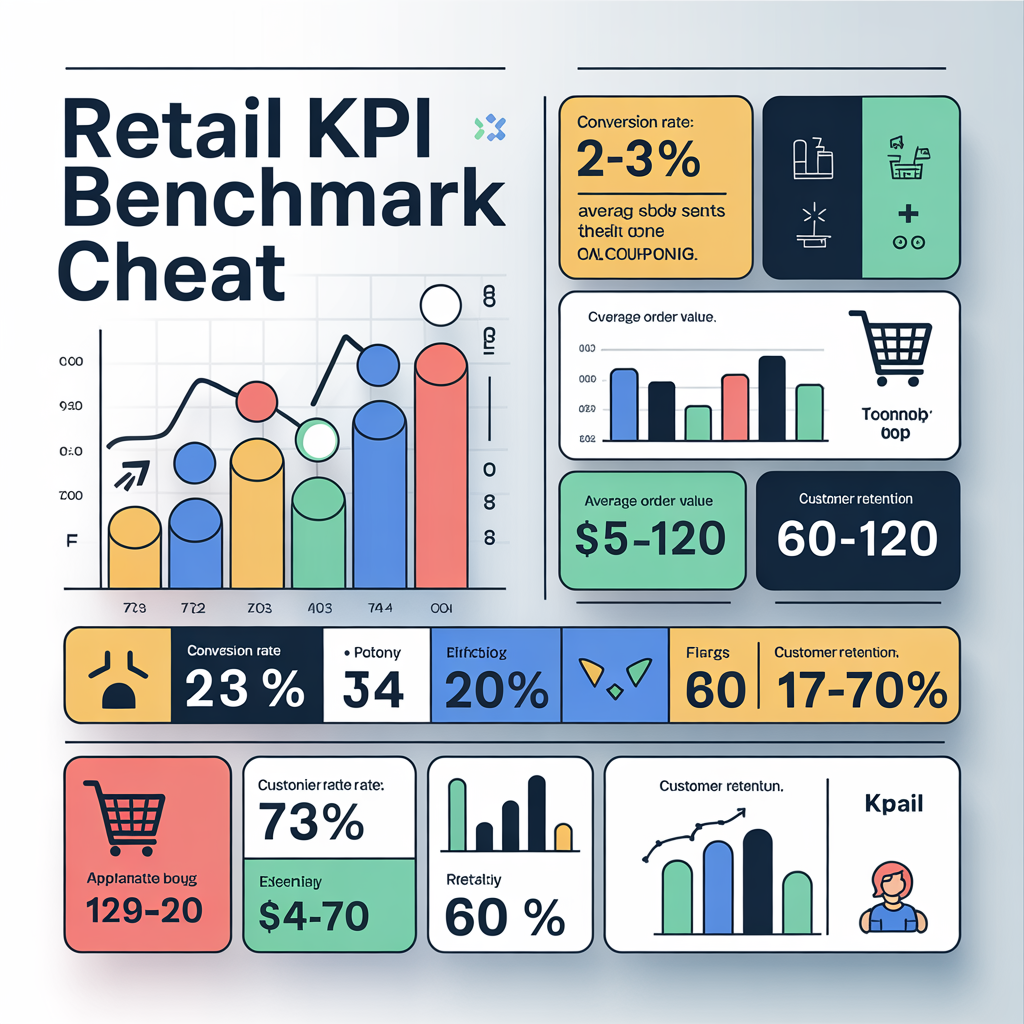
SECTION 1: The Core KPI Benchmark Table
Use this as your instant reference:
-
Conversion Rate (%)
- Excellent: 25–40% (in-store), 2–5% (e-commerce)
- Average: 15–25% (in-store), 1–2% (e-commerce)
- Danger: <15% (in-store), <1% (e-commerce)
👉 If Low:
- Improve sales process / UX
- Train staff
- Reduce friction
-
Average Transaction Value (ATV)
- Excellent: High relative to your category
- Benchmark Rule: Increasing month-over-month
👉 If Low:
- Introduce bundles
- Upsell/cross-sell
- Improve product pairing
-
Units Per Transaction (UPT)
- Excellent: 2.5+
- Average: 1.5–2.5
- Danger: <1.5
👉 If Low:
- Add complementary products
- Train staff to suggest add-ons
-
Gross Margin (%)
- Excellent: 60–70%+
- Healthy: 50–60%
- Danger: <50%
👉 If Low:
- Raise prices
- Reduce discounting
- Improve sourcing
-
Sell-Through Rate (%)
- Excellent: 75–85%+
- Healthy: 60–75%
- Danger: <60%
👉 If Low:
- Reduce buying
- Improve merchandising
- Run targeted markdowns
-
Inventory Turnover
- Excellent: 6–12x per year
- Healthy: 4–6x
- Danger: <4x
👉 If Low:
- Reduce inventory levels
- Increase sales velocity
-
Sales per Labor Hour
- Excellent: Increasing trend
- Danger: Declining trend
👉 If Low:
- Optimize staffing
- Improve productivity
SECTION 2: The KPI Health Scorecard
Score Each KPI (1–3):
- 3 = Excellent
- 2 = Average
- 1 = Needs Improvement
Your Score:
- Conversion: _____
- ATV: _____
- UPT: _____
- Margin: _____
- Sell-Through: _____
- Stock Turn: _____
- Sales/Labor: _____
👉 Total Score: _____ / 21
Interpretation:
- 18–21: Strong performance
- 12–17: Improvement needed
- <12: Serious issues
SECTION 3: The KPI Diagnosis Map
If Conversion Is Low:
👉 Problem = Sales process / experience
If ATV / UPT Is Low:
👉 Problem = Weak upselling / merchandising
If Margin Is Low:
👉 Problem = Pricing or discounting
If Sell-Through Is Low:
👉 Problem = Inventory selection
If Stock Turn Is Low:
👉 Problem = Overbuying / slow movement
👉 Each KPI points to a specific issue
SECTION 4: The “One KPI Focus” Strategy
Rule:
👉 Don’t fix everything—focus on ONE KPI at a time
Example:
- Week 1: Improve conversion
- Week 2: Increase ATV
- Week 3: Optimize margin
👉 Focus = faster results
SECTION 5: Red Flag Patterns (Instant Warnings)
Pattern 1: High Sales, Low Profit
👉 Margin problem
Pattern 2: High Traffic, Low Sales
👉 Conversion problem
Pattern 3: High Inventory, Low Sales
👉 Sell-through problem
Pattern 4: Stable Traffic, Declining Revenue
👉 ATV / UPT problem
👉 Spot patterns instantly
SECTION 6: Weekly KPI Review Routine
Step 1: Track All KPIs
👉 Compare vs benchmarks
Step 2: Identify Weakest Metric
👉 Your focus area
Step 3: Take One Action
👉 Target that KPI
Step 4: Measure Impact
👉 Did it improve?
👉 Repeat weekly
SECTION 7: Advanced Insight — The KPI Stack Effect
Small Gains = Big Results
Example:
- Conversion +10%
- ATV +10%
- Margin +5%
👉 Result: Major profit increase
👉 You don’t need massive changes
SECTION 8: Your KPI Action Plan
Step 1: Identify Weakest KPI
👉 __________
Step 2: Define Target Range
👉 __________
Step 3: Take One Action
👉 __________
Step 4: Track Progress
👉 __________
👉 Consistency beats complexity
Usage Tips / Advanced Applications
- Use weekly for performance tracking
- Apply per store or category
- Combine with dashboards
- Use before major decisions
Wrap-Up
Tracking KPIs without benchmarks is like driving without a speedometer.
This cheat sheet gives you instant clarity on what’s working, what’s broken, and what to fix—so you can operate your retail business with confidence and precision.
Use this asset to instantly shortcut guesswork, diagnose performance fast, and make smarter, data-driven decisions every week.